Help us double down on what's working, instead of guessing. Takes 5 seconds, totally optional.
research · 31 min read
Does Expiring Gamma Move the Market? 4 Years of SPY & QQQ Data
Backtest of 2,002 SPY and QQQ sessions, 2022-2025: when more gamma expires the next day is calmer (28% smaller SPY range), walls break mainly by distance, and 0.25 delta tracks the market's direction.
28%smaller next-day SPY range after heavy-expiry days
Halfas many 1.5%+ SPY days after heavy expiry (31% → 16%)
3 in 4walls within 0.1% of the close broke the next day
2 in 3~30-day covered calls made money
Key findings
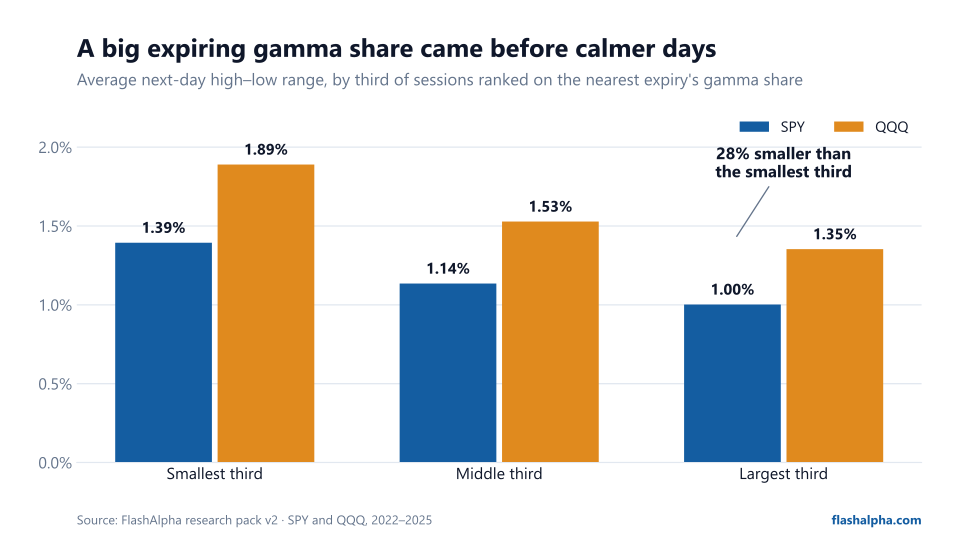
More expiring gamma came before calmer days, not wilder ones. Across 2,002 SPY and QQQ sessions (2022-2025), when the nearest expiry held the largest third of gamma, the next day's high-low range averaged 1.00% for SPY and 1.35% for QQQ, versus 1.39% and 1.89% in the smallest third (both 28% smaller).
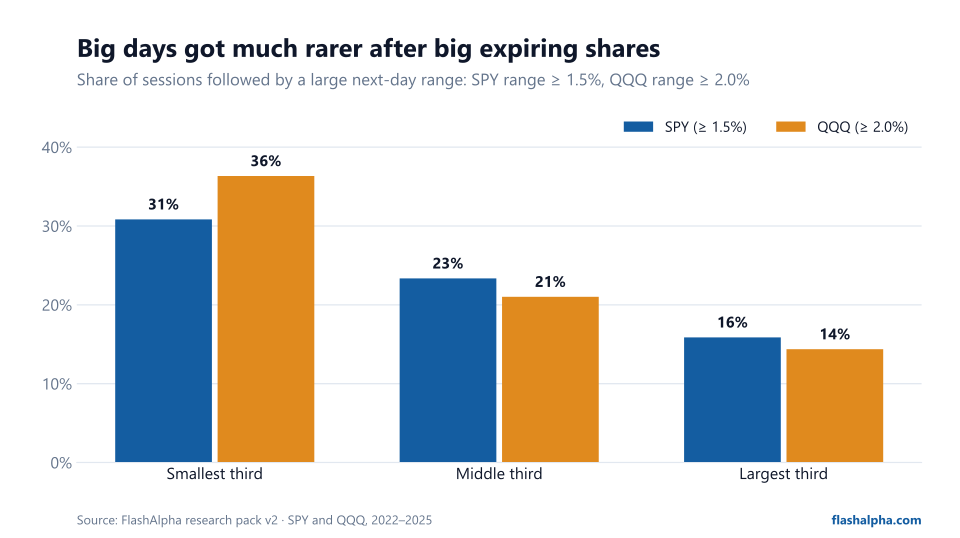
Big-move days roughly halved. A next-day SPY range of 1.5% or more happened on 31% of low-expiry days and 16% of high-expiry days; for a 2% QQQ range, 36% versus 14%.
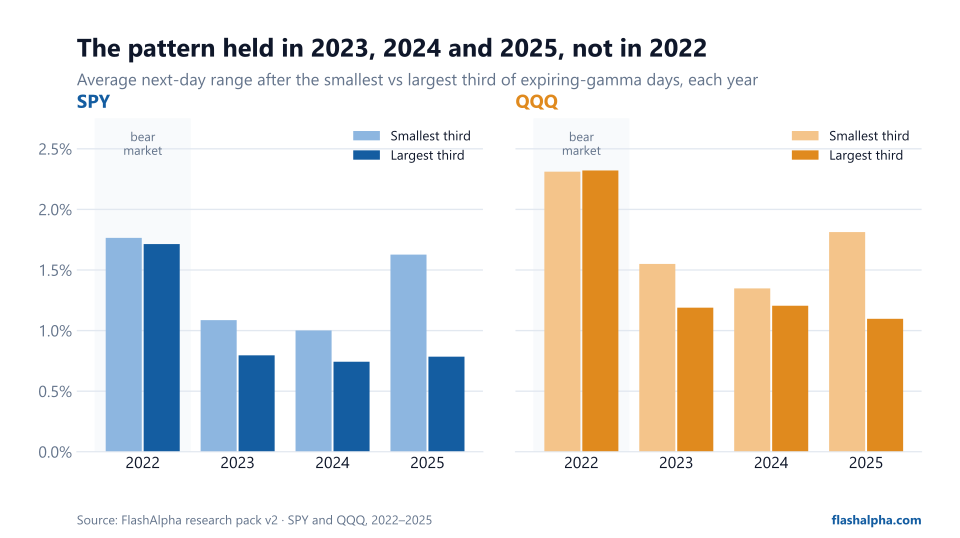
The pattern held in 2023, 2024 and 2025, but not in the 2022 bear market, when the next-day range was about the same whatever share of gamma expired.
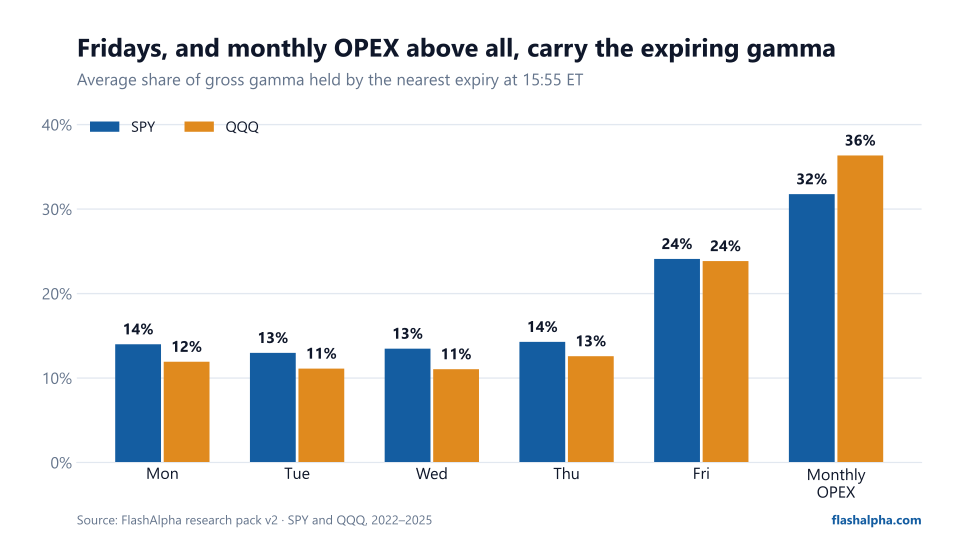
Fridays and monthly OPEX carry the most expiring gamma. On Fridays the nearest expiry held 24% of SPY gamma (vs about 14% Monday-Thursday); on monthly OPEX it was 32% for SPY and 36% for QQQ.
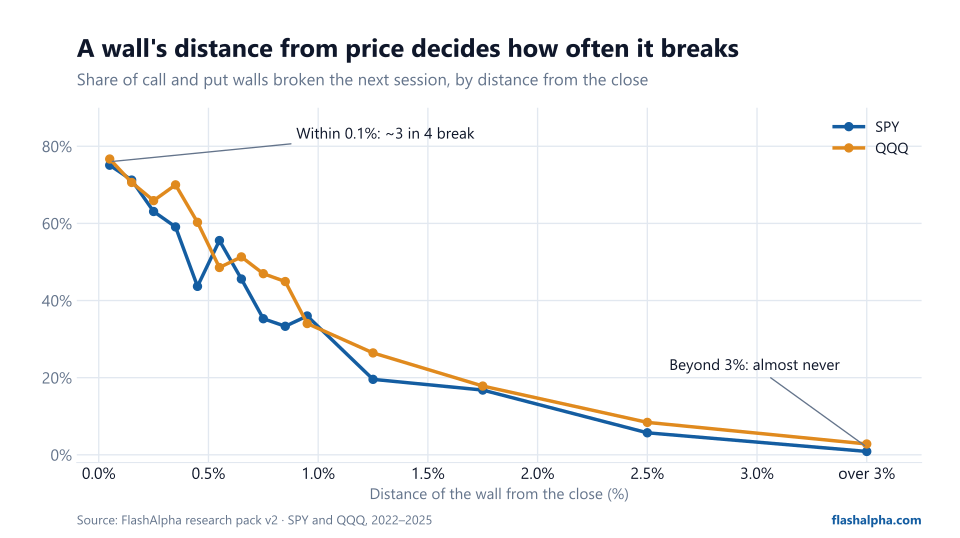
Distance decides whether a wall breaks. Of 3,723 call and put walls, those within 0.1% of the close were crossed the next day 75% (SPY) and 77% (QQQ) of the time; walls more than 3% away broke 1% and 3% of the time.
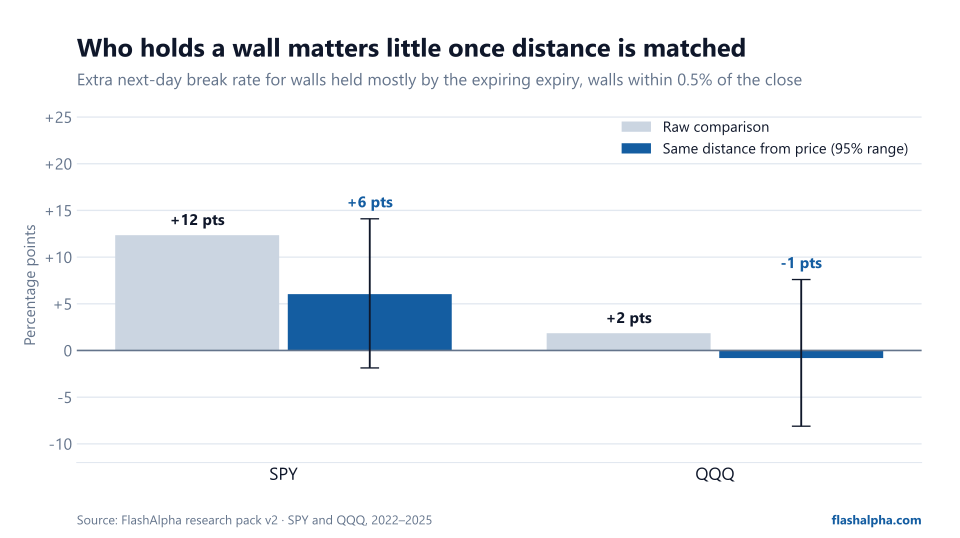
Who holds a wall mattered little once distance was matched: +6 percentage points for SPY and -1 for QQQ, with 95% ranges that include zero.
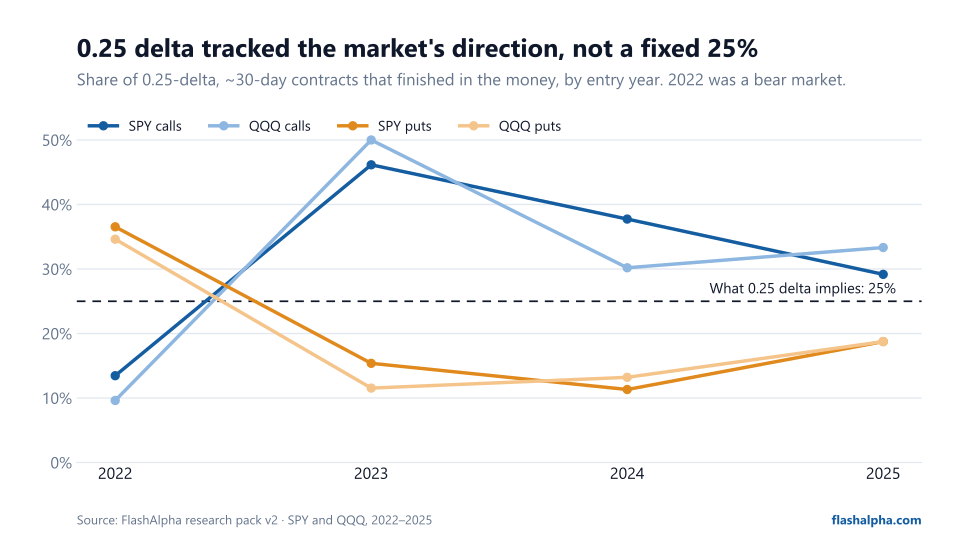
0.25 delta was not a fixed 25% chance. In the 2022 bear market, 0.25-delta ~30-day calls finished in the money 13% (SPY) of the time and puts 37%; in 2023 it flipped to 46% for calls and 15% for puts.
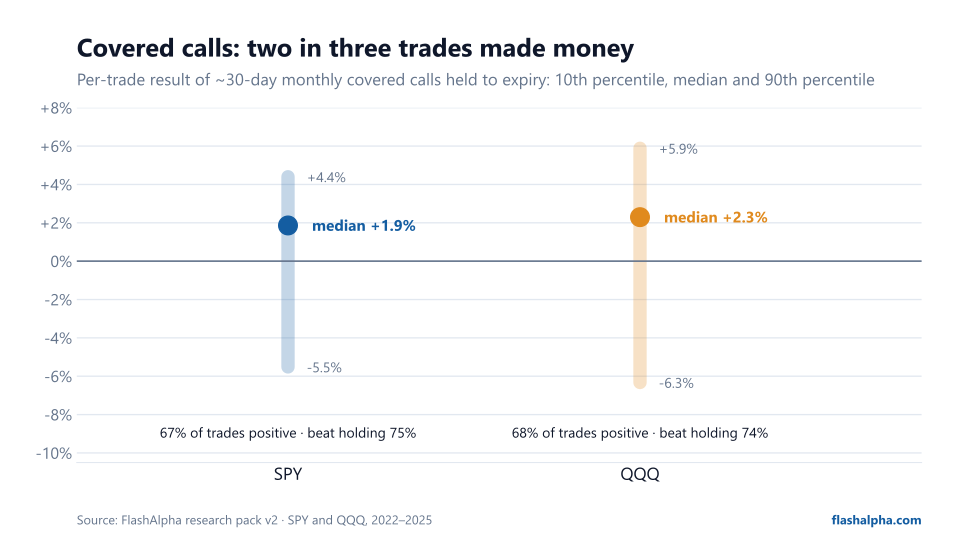
Covered calls made money in about two of three trades. Weekly ~30-day covered calls from the yield-enhancement endpoint were profitable in 67% (SPY) and 68% (QQQ) of trades and beat simply holding the shares in 75% and 74%; cash-secured puts were profitable in 83% and 82%.
Source: FlashAlpha research pack trader-context-spy-qqq-2022-2025-v2-34105d743fac, SPY and QQQ, 3 Jan 2022 to 31 Dec 2025. Figures are descriptive results from that period.
The terms in one line each
Expiring gamma share
The share of total gamma exposure that sits in the nearest expiry, from the expiry impact endpoint, measured five minutes before the close.
Next-day range
The next session's high minus low, as a percentage of today's close.
Call wall / put wall
The strike with the largest call or put gamma. A wall "breaks" when the next session trades through it.
Net GEX sign flip
A session where removing the nearest expiry would flip net gamma exposure from positive to negative, or back.
Gamma concentration
How bunched gamma is across expiries (a Herfindahl index from the term structure endpoint); higher means fewer expiries hold most of it.
0.25 delta
The option's delta at entry. Delta is often read as the chance of finishing in the money.
1. Heavy expiry days came before calmer sessions
We split all sessions into thirds by expiring gamma share and measured the next day's range. The more gamma rolled off, the smaller the next day tended to be, for both SPY and QQQ.
Mean next-day range by expiring gamma share. SPY 1.39% → 1.00%, QQQ 1.89% → 1.35%.Show the data
Next-day range by expiring gamma share (thirds of all sessions, 2022-2025)
Symbol
Expiring share third
Sessions
Mean next-day range
Median next-day range
Mean next-day |return|
SPY
Low (<11.8%)
334
1.39%
1.19%
0.93%
SPY
Middle (11.8-17.3%)
334
1.14%
0.99%
0.80%
SPY
High (≥17.3%)
334
1.00%
0.78%
0.65%
QQQ
Low (<9.6%)
333
1.89%
1.66%
1.30%
QQQ
Middle (9.6-15.3%)
333
1.53%
1.24%
1.02%
QQQ
High (≥15.3%)
334
1.35%
1.14%
0.93%
The effect isn't only in the average. Big days became much rarer: a 1.5%+ SPY range followed 31% of light-expiry sessions but only 16% of heavy ones.
Share of sessions followed by a big next-day range (SPY 1.5%+, QQQ 2%+).Show the data
Share of sessions followed by a big next-day range
Symbol
Threshold
Low third
Middle third
High third
SPY
≥1.5%
30.8%
23.4%
15.9%
QQQ
≥2%
36.3%
21.0%
14.4%
It also held after allowing for how volatile the day itself was (a -0.067 percentage-point change in SPY's next-day range per standard deviation of expiring share, 95% range -0.102 to -0.035).
Year by year: strong in 2023-2025, absent in 2022
Mean next-day range, lowest vs highest third of expiring share, with thirds set within each year.Show the data
Mean next-day range, lowest vs highest third of expiring share, by year (thirds set within each year)
Year
SPY low third
SPY high third
QQQ low third
QQQ high third
Mean expiring share SPY / QQQ
2022
1.76%
1.71%
2.31%
2.32%
15.4% / 12.2%
2023
1.09%
0.80%
1.55%
1.19%
13.9% / 11.9%
2024
1.00%
0.74%
1.35%
1.21%
16.0% / 15.8%
2025
1.63%
0.79%
1.81%
1.10%
17.9% / 16.6%
What it means for you: treat a large expiring share as a sign of a calm, range-bound market, not a countdown to a breakout. In a falling, high-volatility market like 2022, don't lean on it.
2. When the gamma expires: Fridays and monthly OPEX
Daily expiries spread gamma across the week, but Fridays still stand out, and monthly OPEX (the third Friday) is in a league of its own: the nearest expiry held 31.8% of SPY gamma on OPEX versus 15.0% on other days. The average share was highest in 2025: 17.9% for SPY and 16.6% for QQQ, against 13.9% and 11.9% in 2023.
Mean share of gamma in the nearest expiry, by weekday and on monthly OPEX.Show the data
Mean share of gamma in the nearest expiry, by weekday and on monthly OPEX
Symbol
Mon
Tue
Wed
Thu
Fri
Monthly OPEX
Other days
SPY
14.0%
13.0%
13.5%
14.3%
24.1%
31.8%
15.0%
QQQ
11.9%
11.1%
11.1%
12.6%
23.9%
36.4%
13.1%
The session after monthly OPEX was a little quieter than average too (1.05% vs 1.18% for SPY over 46 OPEX days). The same was true on the 107 SPY sessions (10.7%) where the expiring options were big enough to flip the sign of net GEX.
Show the data
Next-day range after sessions where removing the expiry flipped the sign of net GEX
Symbol
Flip days
Share of sessions
Mean next-day range (flip)
Mean next-day range (other)
SPY
107
10.7%
0.95%
1.20%
QQQ
67
6.7%
1.44%
1.60%
What it means for you: expect the biggest roll-off on Fridays and OPEX, and use expiry impact to see whether today's expiry is heavy enough to flip the gamma regime.
3. Walls: distance is almost the whole story
We tracked 3,723 call and put walls from strike dependency. How close a wall sat to the close explained most of whether it broke the next day: about three in four broke from within 0.1%, one in four from 1-1.5%, and almost none from more than 3% away.
Next-day break rate of call and put walls by distance from the close.Show the data
Next-day break rate of call and put walls by distance from the close
Distance from close
SPY walls
SPY break rate
QQQ walls
QQQ break rate
0.0–0.1%
277
75%
176
77%
0.1–0.2%
306
71%
177
71%
0.2–0.3%
149
63%
132
66%
0.3–0.4%
110
59%
100
70%
0.4–0.5%
87
44%
68
60%
0.5–0.6%
72
56%
70
49%
0.6–0.7%
68
46%
76
51%
0.7–0.8%
68
35%
66
47%
0.8–0.9%
42
33%
69
45%
0.9–1.0%
50
36%
47
34%
1–1.5%
184
20%
246
26%
1.5–2%
137
17%
157
18%
2–3%
175
6%
214
8%
>3%
115
1%
285
3%
Call walls broke more often than put walls (50% vs 40% for SPY), mostly because they sat closer (median 0.35% vs 0.68% from the close). Compared distance band by distance band, neither side broke consistently more often.
Show the data
Break rate by wall side (all distances)
Symbol
Side
Walls
Break rate
Median distance from close
SPY
call wall
901
50%
0.35%
SPY
put wall
939
40%
0.68%
QQQ
call wall
932
42%
0.78%
QQQ
put wall
951
36%
1.13%
What about walls held mostly by the expiring expiry? In a raw comparison they broke more often, but they also sat closer. Compared at the same distance, the gap shrank to +6 points for SPY and -1 for QQQ, and neither is statistically clear.
Extra break rate for walls held by the expiring expiry: raw vs compared at the same distance (bars show the 95% range).Show the data
Extra break rate for walls held mostly by the expiring expiry (percentage points)
Symbol
Raw, walls within 0.5%
Same distance from price
95% range
SPY
+12.3
+6.0
-1.9 to +14.1
QQQ
+1.8
-0.8
-8.1 to +7.6
What it means for you: judge a wall by its distance from price first. A wall a few tenths of a percent away is more likely to break than hold.
4. Gamma concentration: a small extra signal for SPY
The median session had gamma spread over 33 SPY and 31 QQQ expiries, with the front expiry holding 14.2% and 12.3%. For SPY, more bunched gamma came with a slightly wider next day even after allowing for expiring share and the day's own range (+0.064 points per standard deviation, 95% range +0.023 to +0.120); for QQQ the effect was +0.016 (-0.075 to +0.101). Term structure and expiry impact also agreed on all 2,002 sessions, so the two endpoints describe the same chain consistently.
5. Yield enhancement: what its picks earned
Every week we asked the yield enhancement endpoint for a covered call and a cash-secured put on the monthly expiry about 30 days out, and held each one to expiry (820 trades).
Per-trade covered-call returns: 10th to 90th percentile with the median.Show the data
Per-trade returns, ~30-day picks from the yield-enhancement endpoint, held to expiry
Trade
Trades
Profitable
10th pct
Median
90th pct
Worst
Beat holding
SPY covered call
205
67%
-5.5%
+1.86%
+4.4%
-14.0%
75%
QQQ covered call
205
68%
-6.3%
+2.29%
+5.9%
-20.9%
74%
SPY cash-secured put
205
83%
-1.9%
+0.71%
+1.3%
-9.7%
–
QQQ cash-secured put
205
82%
-2.3%
+0.92%
+1.7%
-15.5%
–
Two in three covered calls made money and three in four beat holding the shares over the same window. The trade-off shows up in the tails: the worst covered call lost 14.0% (SPY) and 20.9% (QQQ), because the shares still fall while the call caps the rebound. Cash-secured puts won more often (83% for SPY) with smaller gains.
Delta followed the market, not a fixed 25%
Over the whole period, about 31% of 0.25-delta calls and 20% of puts finished in the money. Year by year the picture swings: in 2022 puts were hit far more often than delta implied, and from 2023 calls were.
Share of 0.25-delta, ~30-day contracts that finished in the money, by entry year, against the 25% that delta implies.Show the data
Share of 0.25-delta, ~30-day contracts that finished in the money, by entry year
Year
SPY calls
QQQ calls
SPY puts
QQQ puts
2022
13%
10%
37%
35%
2023
46%
50%
15%
12%
2024
38%
30%
11%
13%
2025
29%
33%
19%
19%
What it means for you: use delta as a ballpark and adjust for the trend. In the rising years, calls were called away more often than delta suggested; in the 2022 decline, puts were assigned more often.
How we did it
Each endpoint was replayed on historical.flashalpha.com five minutes before every close (12:55 ET on half days), exactly as you would call it live.
The rules were frozen before we looked at results (2026-10-17), and the pack rebuilds every number from scratch.
Uncertainty ranges are 95% intervals from a moving-block bootstrap (blocks of 20 consecutive sessions, 2,000 resamples). Year-by-year, weekday, OPEX, wall-distance and trade-outcome figures are computed from the pack's observation files (insights.json).
These are patterns from 2022-2025 that help you read the market, not trading signals on their own.
How to cite this research
FlashAlpha Research (2026).Does Expiring Gamma Move the Market? 4 Years of SPY & QQQ Data. Research pack trader-context-spy-qqq-2022-2025-v2-34105d743fac, SPY and QQQ, 2022-2025. https://flashalpha.com/articles/gamma-expiry-research-spy-qqq-expiry-impact-walls-delta-backtest
All four endpoints are on the Growth plan, and the historical replay and the full research pack are on Alpha. Start with the expiry impact docs, or browse the research packs.
Frequently Asked Questions
Usually the opposite. In SPY and QQQ from 2022 to 2025, when the nearest expiry held the largest third of gamma, the next day's range was 28% smaller for SPY and 28% smaller for QQQ than in the smallest third, and days with a big range were about half as common.
It held in 2023, 2024 and 2025. In the 2022 bear market the next-day range was about the same whatever share of gamma expired.
It depends mostly on distance. Walls within 0.1% of the close were crossed the next day about 75% of the time for SPY; walls more than 3% away almost never were (1%).
Not in a way we could separate from distance. Those walls sit closer to the price, and once walls are compared at the same distance the difference is small and not statistically clear.
Only on average. Over 2022-2025 about 31% of 0.25-delta calls and 20% of puts finished in the money, but the split moved with the market: in 2022 puts were hit far more often, and in 2023 calls were.
About two times in three: 67% of SPY and 68% of QQQ ~30-day covered calls were profitable, with a median of +1.86% and +2.29% per trade.
Yes. The research pack trader-context-spy-qqq-2022-2025-v2-34105d743fac contains every observation, and the summary and derived insights files used on this page are public.
Expiring gamma reads better as a mood than a trigger: heavy expiry days came in calm markets, and calm tended to carry into the next session, except in the 2022 bear market. Walls are mostly about distance, covered calls made money in about two trades in three, and delta drifts with the trend. Every number here traces back to research pack trader-context-spy-qqq-2022-2025-v2-34105d743fac, so you can check today's readings against four years of history.