Help us double down on what's working, instead of guessing. Takes 5 seconds, totally optional.
research · 31 min read
Are Covered Calls Worth It? A SPY & QQQ Backtest
SPY and QQQ covered calls at 6 deltas and 4 expiries, 2022–2026: every setup made less than holding the shares. Weekly calls timed with net gamma beat holding in all 12 weekly setups.
Short answer: not on a fixed schedule. Selling calls against 100 SPY or QQQ shares made less money than holding the shares in all 48 setups we tested, from 0.10 to 0.50 delta and from one week to three months. The calls paid in 2022, when both ETFs fell, and cost money in every rally since. Their one consistent bright spot was timing: weekly calls sold only when FlashAlpha's net gamma reading was positive beat holding in all 12 weekly setups, though that result is not yet statistically established.
48 of 48covered-call setups made less than holding the shares
−$4,327SPY 0.25-delta monthly calls vs holding 100 shares, which made +$32,243
47 of 48setups where calls beat holding in 2022, the down year. 2023: 0 of 48
12 of 12weekly setups that beat holding when calls were sold only with positive net gamma
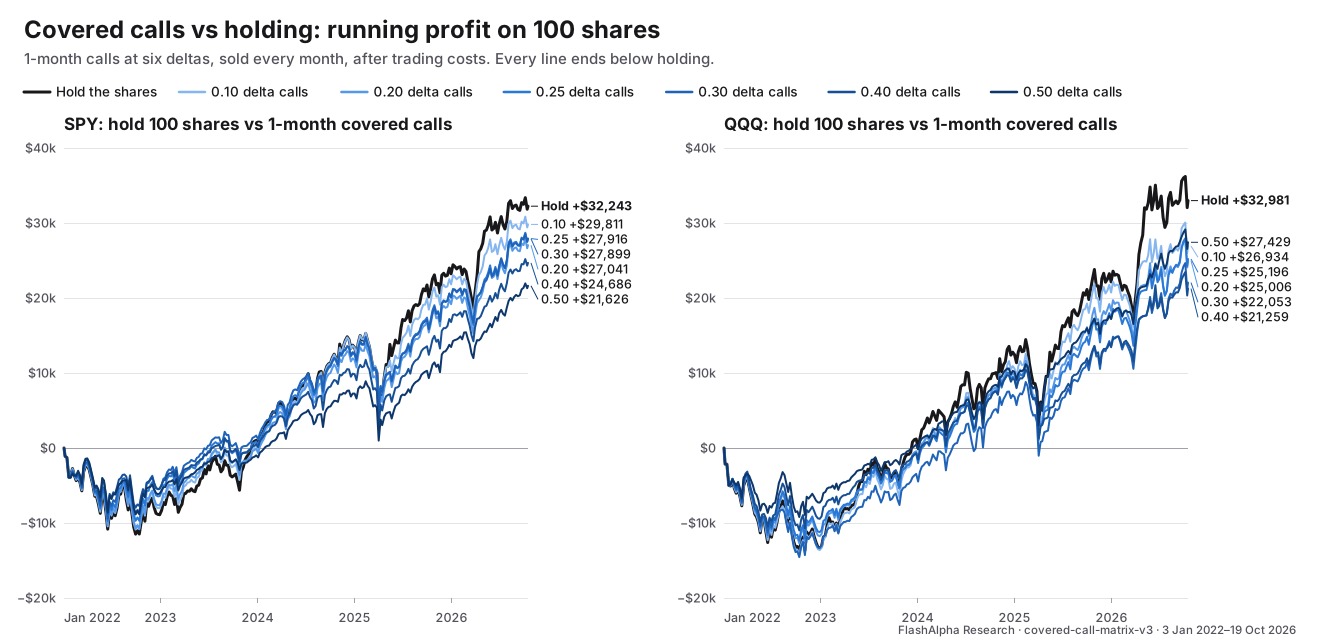
Profit over time: holding vs covered calls
Each line is the running profit on 100 shares bought on 3 January 2022. Covered-call lines include the premium collected, the cost of buying calls back (including any call still open), dividends, and trading costs. Pick an ETF and an expiry; each blue line is one call delta, from 0.10 (far out of the money) to 0.50 (at the money).
In 2022 the covered-call lines mostly sit above holding: the premium cushioned a falling market. For most deltas that lead was gone by late 2023. The April 2025 sell-off briefly pulled some lines level again, but since mid-May 2025 every 1-month line has been below holding. With SPY, 0.10-delta calls finished $2,432 behind holding and 0.50-delta calls $10,617 behind: broadly, the closer the strike, the more upside the calls gave away.
Every delta and expiry
Each cell is the profit from covered calls minus the profit from holding the same 100 shares. Holding made +$32,243 on SPY (+67.5%) and +$32,981 on QQQ (+82.1%). The small print shows how many calls each setup actually sold.
less than holdingmore than holdingDarker = larger gap. Select a cell to chart it.
SPY: Covered calls minus holding 100 shares (+$32,243), 3 Jan 2022 – 19 Oct 2026
Delta
1 week
1 month
2 months
3 months
0.10
−$2,107245 of 250 calls
−$2,43258 of 61 calls
−$77427 of 29 calls
−$3,08819 of 19 calls
0.20
−$4,030236 of 250 calls
−$5,20255 of 61 calls
−$3,37327 of 29 calls
−$5,47319 of 19 calls
0.25
−$4,201237 of 250 calls
−$4,32757 of 61 calls
−$3,58727 of 29 calls
−$6,41919 of 19 calls
0.30
−$4,419239 of 250 calls
−$4,34459 of 61 calls
−$4,34927 of 29 calls
−$7,25419 of 19 calls
0.40
−$6,886235 of 250 calls
−$7,55758 of 61 calls
−$4,51127 of 29 calls
−$9,59819 of 19 calls
0.50
−$2,406210 of 250 calls
−$10,61756 of 61 calls
−$7,18027 of 29 calls
−$12,02219 of 19 calls
QQQ: Covered calls minus holding 100 shares (+$32,981), 3 Jan 2022 – 19 Oct 2026
Delta
1 week
1 month
2 months
3 months
0.10
−$3,749213 of 250 calls
−$6,04756 of 61 calls
−$6,31227 of 29 calls
−$8,27319 of 19 calls
0.20
−$12,693213 of 250 calls
−$7,97556 of 61 calls
−$9,72927 of 29 calls
−$12,70519 of 19 calls
0.25
−$11,548202 of 250 calls
−$7,78555 of 61 calls
−$11,19027 of 29 calls
−$15,27218 of 19 calls
0.30
−$10,363203 of 250 calls
−$10,92856 of 61 calls
−$12,08627 of 29 calls
−$15,86218 of 19 calls
0.40
−$8,261195 of 250 calls
−$11,72255 of 61 calls
−$14,62627 of 29 calls
−$16,23119 of 19 calls
0.50
−$143155 of 250 calls
−$5,55256 of 61 calls
−$15,09027 of 29 calls
−$16,98819 of 19 calls
Three patterns hold. First, 3-month calls cost the most at every delta for both ETFs. Second, for SPY the farthest out-of-the-money calls (0.10 delta) cost the least at every expiry; the cheapest SPY setup overall was 0.10 delta at about 60 days (−$774), and the most expensive was 0.50 delta at 3 months (−$12,022). Third, QQQ, which rose faster, lost more: up to −$16,988.
Why covered calls lost money
A covered call makes money only if the premium you collect is more than the call is worth when you buy it back. In a rising market the calls you sold tend to end up in the money. Over this period, buying the calls back cost more than they were sold for at every delta:
1-month calls, 3 Jan 2022 – 19 Oct 2026, one contract on 100 shares. “Net” also subtracts $1 per contract and $0.01 per share of slippage on each trade.
Delta
SPY premium collected
SPY paid to buy back
SPY net
QQQ premium collected
QQQ paid to buy back
QQQ net
0.10
$5,098
$7,298
−$2,432
$5,829
$11,652
−$6,047
0.20
$11,623
$16,605
−$5,202
$14,547
$22,298
−$7,975
0.25
$16,857
$20,956
−$4,327
$19,224
$26,789
−$7,785
0.30
$22,797
$26,905
−$4,344
$25,617
$36,321
−$10,928
0.40
$35,398
$42,723
−$7,557
$38,626
$50,128
−$11,722
0.50
$50,019
$60,412
−$10,617
$56,572
$61,900
−$5,552
Higher deltas collect more premium, but they also give up more of the rally. In this period the extra upside was worth more than the extra premium. The Options Industry Council's covered call guide describes the same trade-off: limited extra income in exchange for capped upside and only a small cushion on the way down.
When covered calls paid: 2022
Return of the shares including dividends, and what 0.25-delta 1-month calls added or cost versus holding in each calendar year. The last column counts all 48 setups.
Year
SPY return
SPY calls vs holding
QQQ return
QQQ calls vs holding
Setups where calls beat holding
2022
−18.6%
+$2,469
−33.3%
+$2,139
47 of 48
2023
+25.5%
−$2,615
+54.3%
−$4,126
0 of 48
2024
+24.2%
−$767
+25.3%
−$1,217
6 of 48
2025
+17.2%
−$2,298
+20.6%
−$1,791
2 of 48
2026 to 19 Oct
+12.7%
−$1,116
+17.0%
−$2,790
6 of 48
Calls beat holding in nearly every setup in 2022 and in almost none since. Their downside protection was real but modest:
Largest fall from a previous high in 2022, per 100 shares, with 1-month calls
ETF
Hold the shares
0.25-delta calls
0.50-delta calls
SPY
−$11,623
−$10,018
−$8,998
QQQ
−$13,950
−$12,349
−$9,222
The worst fall for 100 SPY shares ran from 4 January to 12 October 2022. 0.25-delta monthly calls made that fall $1,605 smaller, but over the whole period they gave up $4,327 of profit.
The same trade-off over 40 years
Cboe's BXM index sells a one-month at-the-money S&P 500 call every month. From June 1986 to September 2026 it returned 8.6% a year, against 11.2% for the S&P 500 with dividends. It was also smoother: 10.6% annual volatility against 15.2%, and a worst drawdown of −35.8% against −50.9% (Cboe fact sheet, 30 September 2026). Year by year the pattern matches ours: BXM beat the index in 2022 (−11.4% vs −18.1%) and trailed in 2023 (11.8% vs 26.3%), 2024 (20.1% vs 25.0%) and 2025 (8.9% vs 17.9%).
So covered calls are worth it if you want lower volatility and are willing to pay for it with lower long-run returns. They are not a way to earn more than the shares in a rising market.
Can FlashAlpha signals make covered calls worth it?
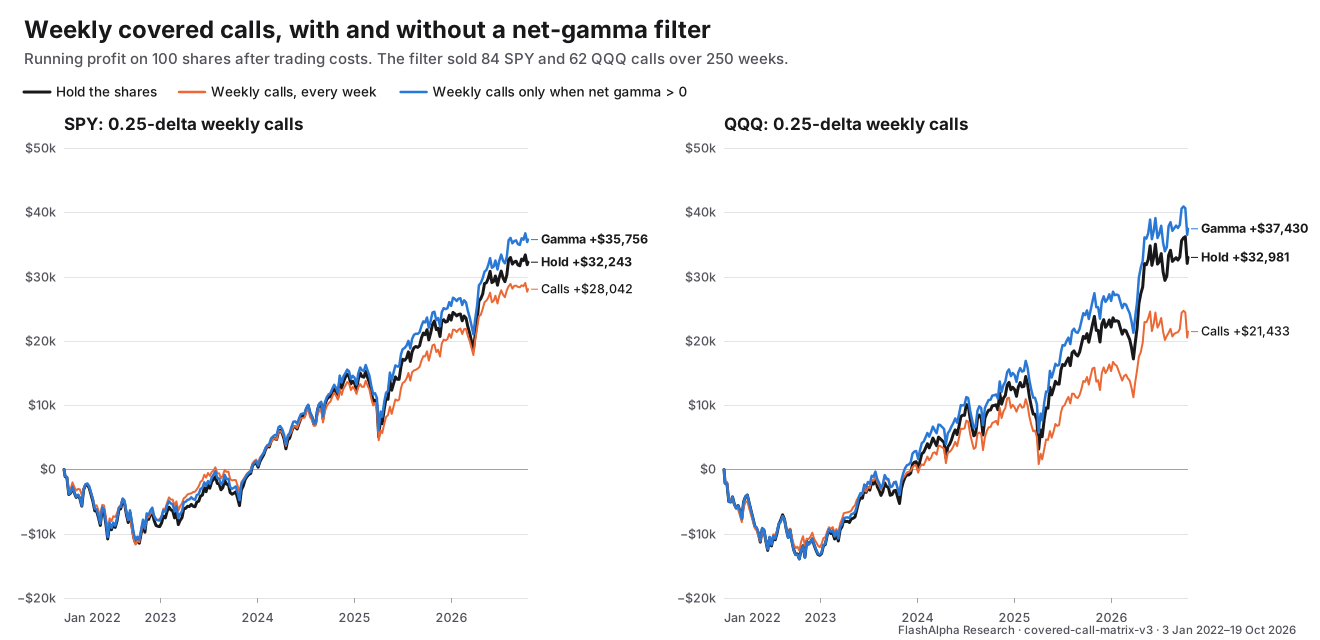
We tested 11 conditions from FlashAlpha's historical API. A filtered strategy uses the same call on the same date as plain covered calls, but sells it only if the condition passes at that moment. Otherwise it just holds the shares. Choose any setup and filter below:
For QQQ 0.25-delta weekly calls, selling every week finished −$11,548 versus holding. Selling only when net gamma was positive finished +$4,449, from 62 of the same 202 calls. For SPY the same setup went from −$4,201 to +$3,513.
All 11 filters across the 48 setups (both ETFs, six deltas, four expiries), 3 Jan 2022 – 19 Oct 2026. Sorted by how often the filter beat holding.
FlashAlpha filter
Calls sold vs no filter
Beat plain covered calls
Beat holding
Median vs holding
Positive net gamma + call-side VRP
32%
47 of 48
30 of 48
+$920
Positive net gamma
37%
47 of 48
27 of 48
+$660
Certified positive-gamma regime
22%
44 of 48
24 of 48
−$26
Nearest expiry holds 20%+ of gamma
29%
27 of 48
9 of 48
−$5,968
5-day realized vol at or below 20-day
57%
36 of 48
7 of 48
−$2,504
Positive call-side VRP
93%
32 of 48
6 of 48
−$6,116
Yield endpoint says candidate or neutral
77%
26 of 48
4 of 48
−$5,576
Yield endpoint says candidate
41%
40 of 48
3 of 48
$0
Call wall between price and strike
82%
22 of 48
2 of 48
−$6,058
3-month VIX at or above VIX
93%
42 of 48
0 of 48
−$4,531
Nearest expiry doesn't flip gamma sign
90%
10 of 48
0 of 48
−$7,204
No filter (sell every time)
100%
—
0 of 48
−$7,217
Only the three gamma-regime filters beat holding in at least half the setups. They sell roughly a third as many calls. That alone moves a losing strategy toward holding, but the two net-gamma filters did more: in most setups the calls they did sell made money (median +$920 and +$660 versus holding). Filters that sell almost every time, such as “3-month VIX at or above VIX” and “Nearest expiry doesn't flip gamma sign”, never beat holding. The yield endpoint said “candidate” mostly for weekly calls at higher deltas, which lost money; for calls of a month or longer it almost never did, so that filter mostly just held the shares.
Where the positive-gamma filter worked
Covered calls sold only when net gamma was positive, compared with holding 100 shares. Six deltas per row.
Expiry
SPY: beat holding
SPY: range
QQQ: beat holding
QQQ: range
1 week
6 of 6
+$1,308 to +$4,746
6 of 6
+$1,683 to +$6,725
1 month
6 of 6
+$316 to +$2,379
0 of 6
−$12,292 to −$5,682
2 months
3 of 6
−$2,387 to +$902
0 of 6
−$2,455 to −$1,054
3 months
0 of 6
−$3,731 to −$313
6 of 6
+$629 to +$2,074
The weekly result is the clearest. It held for every delta on both ETFs, in most individual years, and in 11 of 12 setups at ten times the base slippage ($0.10 per share on each trade). Longer expiries are inconsistent: SPY 1-month calls beat holding but QQQ 1-month calls lost at every delta. A gamma reading taken on the sale date says little about a call that stays open for one to three months.
How much to trust it
It is one period of under five years.
The 12 weekly setups trade the same weeks on the same signal, so they are not 12 independent confirmations.
Compared with picking the same number of weeks at random, the filtered calls ranked between the 95th and 99.96th percentile.
After correcting for all 660 filter comparisons in the study, the strongest result, QQQ 0.25-delta weekly calls, has an adjusted probability of 0.30. That is not statistically significant.
Treat it as a specific rule worth testing on new data, not as an established edge.
How the backtest works
Data: FlashAlpha historical option quotes for SPY and QQQ at 15:55 ET, 3 January 2022 to 19 October 2026 (1,203 sessions).
Position: buy 100 shares at the ask on 3 January 2022 and hold them throughout. Dividends are kept as cash, earning no interest. Hold at most one short call at a time.
Which call: at each roll, take the expiry nearest the target (bands of 4–10, 25–35, 53–67 and 80–100 days), then the out-of-the-money call nearest the target delta, within 0.05. It must have open interest of at least 250, a bid/ask spread of at most 20%, and a quote no more than five minutes old. If no call qualifies, sell nothing until the next roll.
Trades: sell at the bid and buy back at the ask at 15:55 ET on expiry day (12:55 on early-close days), then sell the next call. Each option trade pays $1 per contract plus $0.01 per share of slippage. We also tested $0.05 and $0.10.
Not modeled: early assignment, taxes, interest on cash, and the cost of an API subscription.
Endpoint and field behind each filter
Each condition is read from the historical API at the time the call would be sold (normally 15:55 ET). If a value is unknown, no call is sold.
Filter
Endpoint
Sell the call when
Positive net gamma
/v1/exposure/term-structure/{symbol}
gamma_concentration.totals.net_gex_usd > 0
Certified positive-gamma regime
/v1/vrp/{symbol}
regime.gamma is positive and regime.gamma_flip_status is available
Positive net gamma + call-side VRP
term-structure + /v1/vrp/{symbol}
net_gex_usd > 0 and directional.upside_vrp > 0
Nearest expiry holds 20%+ of gamma
/v1/exposure/term-structure/{symbol}
nearest expiry’s by_expiry[].gross_share_pct ≥ 20
Nearest expiry doesn't flip gamma sign
/v1/exposure/expiry-impact/{symbol}
impact.net_sign_changed is false
Call wall between price and strike
/v1/exposure/levels/{symbol}
price < levels.call_wall ≤ call strike
Positive call-side VRP
/v1/vrp/{symbol}
directional.upside_vrp > 0
3-month VIX at or above VIX
/v1/vrp/{symbol}
macro.vix_3m ≥ macro.vix
5-day realized vol at or below 20-day
/v1/vrp/{symbol}
vrp.rv_5d ≤ vrp.rv_20d
Yield endpoint says candidate
/v1/strategies/yield-enhancement/{symbol}
decision = candidate
Yield endpoint says candidate or neutral
/v1/strategies/yield-enhancement/{symbol}
decision is candidate or neutral
Run your own version
Every filter in this study reads a FlashAlpha endpoint at the moment the call would be sold. On the Alpha plan, the Historical API replays those endpoints at any past minute in the archive, so you can test your own deltas, expiries and conditions. See plans.
Cite this research
FlashAlpha Research. “Are Covered Calls Worth It? A SPY & QQQ Backtest.” 20 October 2026.
Frequently asked questions
Are covered calls worth it?
Not on a fixed schedule in this test. From 3 January 2022 to 19 October 2026, selling calls against 100 SPY or QQQ shares made less money than holding the shares in all 48 setups tested, by $774 to $16,988 per 100 shares. Calls helped in 2022, when both ETFs fell, and cost money in the rallies of 2023 to 2026.
Which delta and expiry worked best for covered calls?
None beat holding. The smallest shortfall was SPY 0.10-delta calls with about 60 days to expiry (−$774 per 100 shares). 3-month calls cost the most at every delta for both ETFs, up to −$16,988 for QQQ 0.50-delta calls.
Do covered calls reduce risk?
A little. In 2022 the largest fall for 100 SPY shares was $11,623; with 0.25-delta monthly calls it was $10,018. That cushion was much smaller than the upside the calls gave up later.
Can FlashAlpha data improve covered calls?
In this backtest, selling weekly calls only when FlashAlpha's net gamma exposure was positive beat holding in all 12 weekly setups, by +$1,308 to +$6,725 per 100 shares. After correcting for the 660 filter comparisons we ran, the result is not statistically established, so treat it as a lead to test, not proof.
Related research
When not to sell options - negative-gamma days held most short-premium losses on SPY and QQQ, 2022 to 2026
Selling covered calls on SPY or QQQ on a fixed schedule cost money compared with holding the shares from 2022 to 2026, at every delta and expiry we tested. The calls paid in the 2022 decline and lost in the rallies. Timing weekly calls with FlashAlpha's net gamma reading beat holding in all 12 weekly setups, but it is one period and not yet statistically established.