Help us double down on what's working, instead of guessing. Takes 5 seconds, totally optional.
Market Overview
Data-driven market structure analysis powered by lab.flashalpha.com - volatility, dealer positioning, and regime assessment across the index complex, refreshed multiple times per trading day. Every number is pulled straight from our API endpoints by deterministic code.
FlashAlpha ResearchAI-assisted
Generated
Validated citations - no literal numbers from LLM
You're reading yesterday's market analysis
Basic unlocks today's post-open analysis (9:45 ET).
Growth unlocks all 3 daily refreshes (open, midday, close) plus actionable trade ideas and “What it means for your trading”.
Growth unlocks the full trading day: midday (12:30 ET) + close wrap (4:15 ET), actionable trade ideas per section, and “What it means for your trading” analysis.
SPY 754.08 sits below gamma flip 765.30 - dealers short gamma across index complex, moves get amplified
Index complex closed with SPY 754.08 beneath its gamma flip at 765.30, leaving dealers short gamma across SPY, QQQ and IWM. VIX at 17.56 in contango and VVIX at 95.89 say no jump-risk blowout, but Fear & Greed at 26 shows sentiment more nervous than the vol surface. Best expected value sits in Short Put Spread at 21-30 DTE while spot mean-reverts around the 755 pivot.
Dealer positioning levels
Symbol
Spot
Gamma flip
vs Flip
Call wall
Put wall
Max pain
Net GEX
Regime
SPY
754.08
765.30
-1.47%
760
750
755
-$15.12B
Short gamma
QQQ
705.03
714.99
-1.39%
710
700
705
-$5.99B
Short gamma
IWM
283.74
295.97
-4.13%
290
280
290
-$6.54B
Short gamma
VIX
17.71
-
-
20
17
19
$3.72M
-
Spot below the gamma flip means dealers are short gamma and hedge with the move, which amplifies range. Above it they hedge against the move, which dampens it.
Volatility and risk premium
Symbol
ATM IV
HV 20d
VRP
25d skew
P/C OI
P/C volume
SPY
14.28
9.06
+5.22
3.87
2.59
1.26
QQQ
18.70
11.81
+6.89
4.47
1.44
1.37
IWM
19.35
12.88
+6.47
4.71
2.56
2.00
VIX
78.13
91.54
-13.41
-81.16
0.34
0.41
VRP is implied minus realised volatility. Positive means options are pricing more movement than has actually occurred, which favours sellers.
Volatility complex
Measure
Value
Change
VIX
17.56
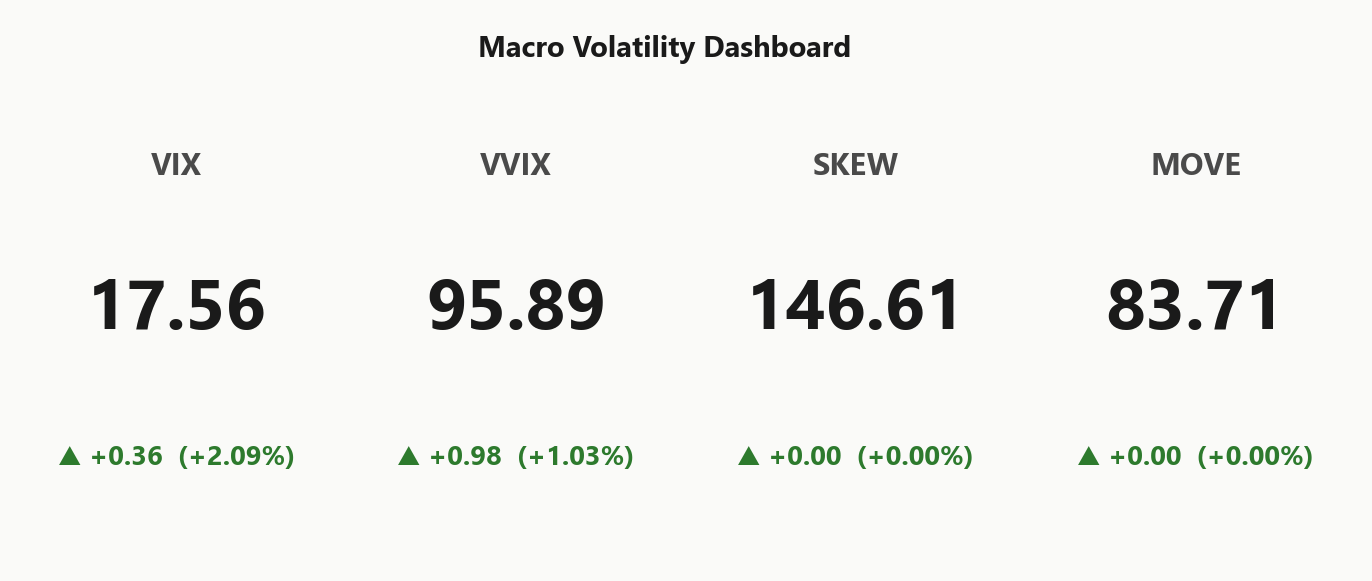
+2.09%
VVIX
95.89
+1.03%
SPX
7,551.81
-0.45%
SKEW index
146.61
0.00%
MOVE (bond vol)
83.71
0.00%
VIX term (9d/30d/3m/6m)
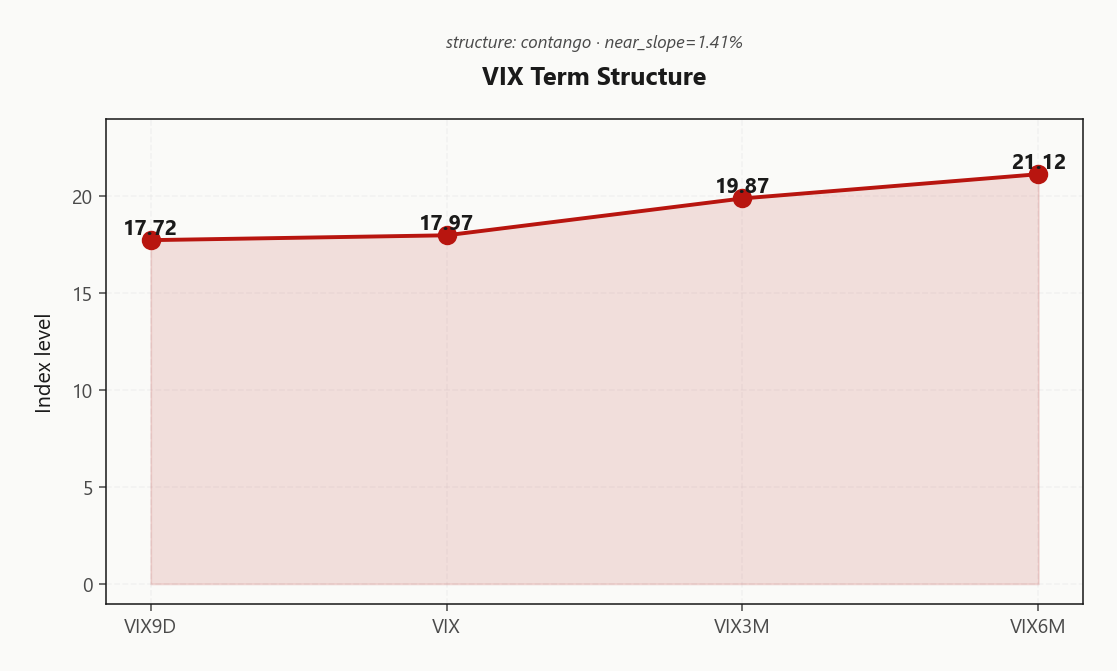
17.72 / 17.97 / 19.87 / 21.12
Steep contango
VVIX / VIX
5.46
Normal
Regime
Elevated / Watchful
Regime Assessment
Regime tag lands at Elevated / Watchful with VIX at 17.56 - sitting in the elevated band, not the panic tail. The Elevated classification carries a half-life of 15 sessions, sticky enough to fade with conviction but too persistent to sleep on into any macro print.
Transition math is the tell. Probability of a jump to panic over the next 0.05 five sessions stays low but non-zero - cheap tail wings are a rounding error against carry, so own them. Probability of retreat to the low-vol regime inside ten sessions runs 0.45, effectively a coin flip on quick calm.
Trade the persistence, not the tails. Elevated-but-anchored is the harvest window for defined-risk premium sellers; keep gross moderate and let the half-life do the work while the tape hunts for its next catalyst.
What it means for your trading
Regime is Elevated / Watchful at VIX 17.56 with a 15-session half-life - fade the vol, own cheap tail against the 0.05 five-session panic probability.
Trading readVIX modest, VVIX normal, MOVE contained, Fear & Greed at fear - one of these is not like the others. The sentiment gauge is the tell: retail nerves are heavier than the option surface, and that divergence usually resolves toward whichever way spot breaks first.VIX = equity vol. VVIX = vol of vol (is the fear gauge itself being stressed?). SKEW = cost of tail hedges vs ATM. MOVE = bond vol. Divergences between them (e.g. calm VIX but elevated VVIX) often precede regime shifts.
Forward Vol Geometry
The VIX curve sits in Contango with near slope 1.41% - VIX9D at 17.72 pinned just under spot VIX at 17.97. The front is anchored, not backwardated: the market is not pricing an imminent shock, so front-month vol sellers keep the carry without paying a jump premium.
The intermediate belly does the heavy lifting. VIX3M at 19.87 steps up to VIX6M at 21.12 - a steep contango into six months, with forward 30-to-60 vol printing 20.7548765354. That is where the surface is richest and where roll-down compounds fastest against a short.
Regime tag Steep Contango - Steep contango - vol sellers favored. The edge concentrates in the 21-30 DTE bucket: long enough to harvest the belly's forward premium, short enough to sidestep the six-month tail bid. Defined-risk only while spot trades below the flip.
What it means for your trading
Curve in Contango with the belly bid - sell the 21-30 DTE roll-down where forward 30-to-60 at 20.7548765354 is richest, and keep it defined-risk under the negative-gamma backdrop.
Trading readContango is steep enough that the vol carry trade still works, but the near end hasn't compressed enough to suggest complacency - surface priced neither for calm nor stress, which is the harvest zone for defined-risk premium sellers.Forward VIX curve: VIX9D (9-day), VIX (30-day), VIX3M, VIX6M. Upward slope (contango) = calm regime + vol sellers favored. Downward (backwardation) = stress, vol buyers favored. Slope matters more than level.
Realized Vol Structure
ATM IV at 14.28% against 20-day realized of 9.06 leaves SPY VRP at 5.22% - sellers are being paid a multi-vol premium over what the tape is actually delivering. The gap is structural, not a one-print anomaly: HV60 at 11.61 confirms the longer window hasn't caught up either, so there is no incoming realized ramp to catch premium sellers offside.
The richness deepens across the complex. QQQ VRP prints 6.89% with the tech tape quieter than the surface implies, and IWM VRP sits at 6.47% - small-caps are paying up despite delivering less. That is the cleanest carry setup on the board, but the negative-gamma backdrop means every short-vol expression has to be defined risk. Dealer amplification below flip turns any naked short into a leveraged bet on spot behaving, and the tape does not owe you that.
What it means for your trading
Options are meaningfully rich to realized across SPY, QQQ and IWM with VRP of 5.22%, 6.89% and 6.47% respectively - sellers get paid, but only through defined-risk structures while dealers stay short gamma.
Skew Convexity
The quarter-delta skew prints at 3.87% with a smile ratio of 1.23% - puts are bid, but the shape is ordered demand, not hedging panic. Put-side vol at 20.7% against ATM 18.83% shows measured downside insurance rather than a scramble for wings.
The call side is the tell: 16.83% against ATM at 18.83% leaves upside vol flat - no one is chasing calls, and no dealer is short enough upside gamma to force a squeeze bid. That asymmetry means any rip has to fight a supply of overwriter flow while dips find real put demand underneath.
IWM confirms the picture with a smile ratio of 1.2% - small-caps carry the same downside tilt, so the surface is not idiosyncratic to SPY. Trade the shape: put-spread sellers get paid the steep side, call-spread buyers get the cheap wing, and there is no upside convexity worth chasing outright.
What it means for your trading
Skew of 3.87% and smile ratio 1.23% confirm downside bias without panic - sell the rich put wing in defined-risk structures, and avoid paying up for upside convexity while call vol at 16.83% sits flat to ATM.
Vol-of-Vol Structure
VVIX prints 95.89 against VIX 17.56, a ratio of 5.46 that classifies vol-of-vol as Normal. No jump premium is getting paid up, no bimodal tail is being priced into the surface, and the signal reads Green across the vol-of-vol dashboard.
The practical read: sizing guidance stays Standard Size. Books do not need to shrink into the negative-gamma index backdrop - the surface is not bidding for a discontinuous move, so defined-risk short-vol structures can run full clip rather than half-size. VVIX sits well inside its normal band, nowhere near the blowout zone that would force convexity buyers to chase.
Watch the ratio for compression toward the front - a spike in VVIX without a matching VIX move is the first tell that dealers start pricing the jump. Until then, Normal vol-of-vol is the green light behind every premium-selling structure the rest of the note recommends.
What it means for your trading
VVIX at 95.89 and a 5.46 ratio keep vol-of-vol classified Normal - no jump premium, sizing stays Standard Size. Green-light backdrop for defined-risk short-vol expression while the index complex trades below flip.
Dispersion Spread
Index vol prints show a real tech premium: SPY ATM IV at 14.28% sits well beneath QQQ at 18.7%, with IWM at 19.35% pricing small-caps in the same neighborhood as tech. That gap is the dispersion tell - mega-cap idiosyncratic risk is doing the work, and SPY's diversification is quietly damping the aggregate print.
Cross-index correlation is moderate, not locked, so SPY hedges only partially cover a single-name blow-up in the QQQ complex. With the top GEX shifts stacked in META, AAPL, MSFT, NVDA and GOOGL, an index put alone underwrites the tape but not the constituent tail. IWM tracking tech-like richness underscores the correlation compression - small-caps aren't offering a diversification discount either.
Preferred expression: sell SPY vol over single-name in this regime. Index premium is the cleaner short with dealers already amplifying spot below flip; single-name shorts inherit the fatter tail without the compensating carry.
What it means for your trading
SPY ATM IV 14.28% vs QQQ 18.7% and IWM 19.35% flags a live tech-premium dispersion - index hedges under-cover idiosyncratic mega-cap risk, so prefer defined-risk SPY vol selling to single-name shorts.
Liquidity & Microstructure
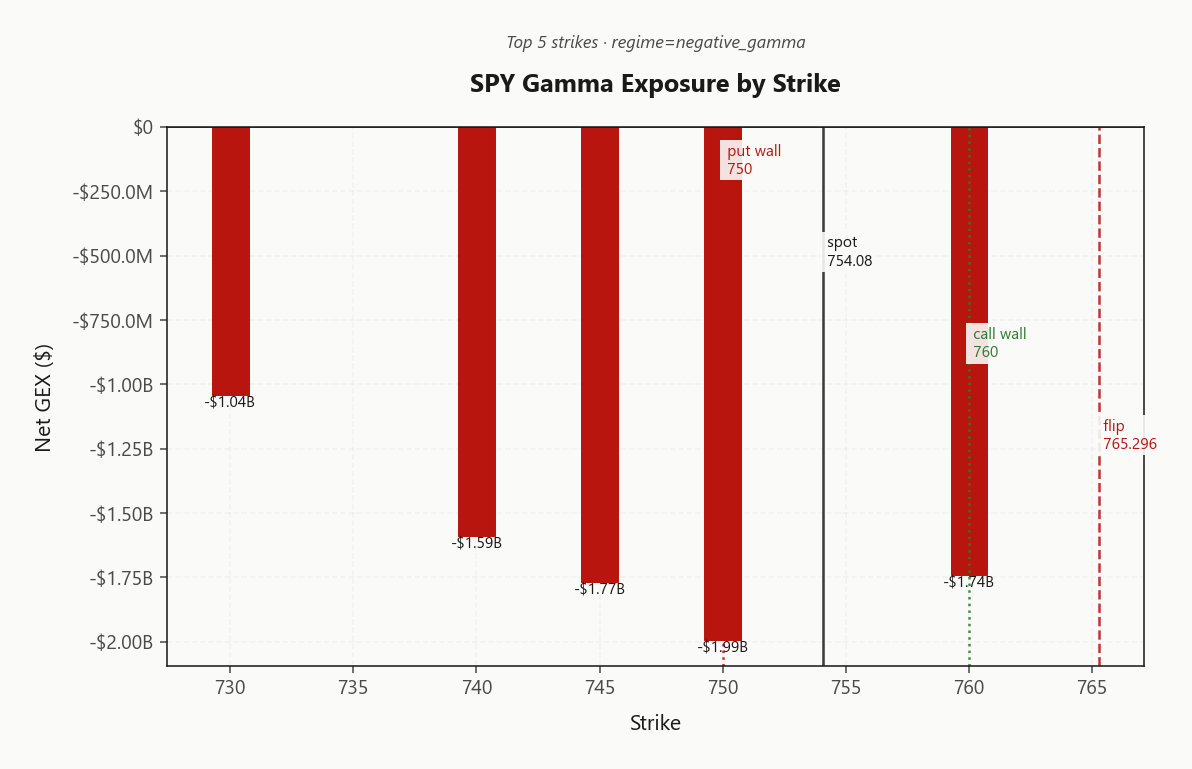
The book anchors at strike 525 for open interest, but the live gravity sits higher: gamma flip prints 765.30 with spot underneath, so dealer hedging trend-follows in both directions rather than dampening. Every push gets amplified until spot reclaims the flip.
The dominant local sink is strike 750.00 at net GEX -$1.99B - that's where hedging pressure concentrates and where the tape will grind. Call wall 760.00 caps rally attempts; put wall 750.00 is the first line of support and the level where trend-following flow gets ugly if it breaks.
OI-weighted DTE at 83 says the book still leans longer-dated - this is not a 0DTE-dominated pin machine. Expect larger, slower moves driven by structural OI rather than intraday gamma bursts.
What it means for your trading
Spot below flip 765.30 keeps dealers trend-following into the 760.00/750.00 bracket, with the 750.00 sink concentrating flow. Longer-dated OI weight (83) argues for structural, not 0DTE-driven, tape.
Trading readThe strike-level GEX is negative all the way down from the call wall - dealers amplify every push in either direction, so intraday breakouts have follow-through instead of fading. Trade with trend until spot reclaims the flip, then flip to fade.Net dealer gamma exposure at each strike. Green bars = dealers long gamma (dampens moves toward the strike), red bars = short gamma (amplifies moves). Lines show spot, gamma flip (regime boundary), and the highest-gamma call/put strikes (walls).
Dealer Vanna & Charm
Net vanna at -$42.18B says the same thing the gamma book already whispered: Vol up = dealers sell delta - downside amplified if vol spikes. A vol spike into weakness compounds the sell rather than cushioning it, and there is no offsetting greek to lean on for a reflex bounce while spot sits under 765.30.
Charm reads Time decay pushing dealers to sell - pressure into close at net -$2.7M - late-session decay pushes dealers the same way vanna does, so the last hour tends to add pressure rather than fade it. The vector is aligned bearish across all three greeks; that is the setup where negative-gamma tape has follow-through instead of mean-reversion.
The single line that matters is the Max Pain pivot at 755, currently 0.1220029705 from spot. Current dealer lean reads Neutral - no directional bias until price picks a side of that level. A reclaim flips the vanna/charm bundle from accelerant to brake; a rejection keeps the trend-follow machine armed into tomorrow's open.
What it means for your trading
Vanna at -$42.18B and charm at -$2.7M point the same direction as gamma - vol-up compounds the sell and time decay presses into the close. Watch pivot 755: while dealer bias holds Neutral, the tape trend-follows, and only a clean break flips the regime.
Cross-Asset Confirmation
MOVE at 83.71 keeps rates vol tame - no credit channel is compounding the equity fragility read, and the bond tape isn't dragging spreads wider into the Fed print. That matters because a negative-gamma index complex only turns into a real accident when a second asset class starts moving in size; right now the cross-asset tone reads Unknown with divergence direction Aligned, so the risk stays contained inside equity vol.
The tell is inside the index complex itself. QQQ mid 705.03 against IWM 283.74 - small-caps are the usual fragility lead, and their alignment with tech under the flip says the whole book is leaning the same way rather than one sleeve cracking first. Three-for-three negative gamma with rates vol quiet is the classic coiled setup, not the breaking one.
Fear & Greed prints 26 at Fear - sentiment is heavier than the options surface, and that gap is the day's most tradeable divergence. Under the flip, treat it as confirmation; on a reclaim, treat it as contrarian fuel for the mean-revert bounce.
What it means for your trading
Cross-asset picture is Aligned with MOVE at 83.71 and no credit-shock compounding - the fragility is contained inside equity vol, but Fear & Greed at Fear flags sentiment running heavier than the surface prices.
Scenario EV
Scenario scoring puts Short Put Spread at the top of the book with a best score of 61, edging the iron condor at 57. The put-spread score of 61 reflects the negative-gamma amplification risk below the flip at 765.30 - defined-risk downside beats a two-sided condor when the tape trend-follows in both directions.
Optimal window sits at 21-30 DTE, where roll-down is steepest under the Steep Contango curve and the VIX3M-to-VIX6M step at 19.87 vs 21.12 pays sellers cleanly. VRP assessment prints Unknown - carry is live, but sizing stays capped while spot sits under 765.30 and the charm pivot at 755 hasn't flipped bias.
Signal color Yellow is the tell: selective, not full-throttle. Run the put spread, skip naked strangles and calendars, and let the pivot at 755 arbitrate whether tomorrow adds to the position or takes it off.
What it means for your trading
Best expected value is Short Put Spread at 21-30 DTE - capped-risk premium selling that harvests the Steep Contango roll-down without leaning naked into negative-gamma amplification. Signal Yellow keeps sizing selective until the pivot at 755 reclaims.
Actionable Summary
With SPY closing below the gamma flip at 765.30 and the index complex aligned short-gamma, the playbook is defined-risk premium selling - not naked short vol. Best expected value sits with Short Put Spread in the 21-30 DTE window, where steep contango feeds roll-down and capped loss protects against dealer amplification below the flip.
Watch pivot 755 - a reclaim flips the Elevated / Watchful regime back toward mean-revert and unwinds the trend-follow bias. Bracket the tape between put wall 750.00 as first support and call wall 760.00 as first resistance. Layer cheap long put wings for tail hedge - VVIX at 95.89 isn't pricing the jump, so convexity is on sale.
What it means for your trading
Sell defined-risk put spreads in the 21-30 DTE bucket while spot holds below 765.30; avoid naked strangles and calendars until the 755 pivot flips the regime.
Fed decision day is the reason vol is bid across the index complex - the outcome will either validate the contango or force a rapid front-end repricing.
Direct US-Houthi contact hints at de-escalation optionality - if talks progress, it's a marginal supportive nudge for risk assets and VIX carry trades.
10Y hovering above 5% into the Fed print is the single biggest cross-asset variable - a hawkish reaction would jam equity vol and flip cross-asset tone in an afternoon.
Frequently Asked Questions
What is the current market volatility regime?
VIX is trading at 17.71 with a Contango term structure. The Fear & Greed index reads Fear, and cross-asset volatility is Aligned across SPY, QQQ, and IWM.
SPY's gamma flip is at 765.30 against a spot of 754.08. Above flip, dealer hedging is suppressive; below it, hedging amplifies moves.
Is implied volatility rich or cheap versus realized?
SPY's at-the-money implied vol is 14.28% with a volatility risk premium of 5.22%. Negative VRP means options are cheap relative to recent realized moves; positive VRP means insurance is expensive.
What does the VIX term structure say today?
The VIX curve is in Contango with VIX at 17.56. Contango signals benign forward expectations; backwardation signals near-term stress.
You're reading yesterday's market overview. Upgrade to Basic and get today's post-open analysis - the same data institutional desks use to set positioning each morning.
Unlock the full trading day
You see the market-open report. Growth gives you all 3 daily refreshes - midday regime shifts, close-wrap positioning, plus actionable trade ideas and "What it means for your trading" analysis.
What Basic includes
Today's market-open analysis
SPY, QQQ, IWM, VIX gamma regime
Key levels - flip, walls, max pain
VIX term structure + VRP analysis
Charts with trading reads
Full API access to lab.flashalpha.com
What Growth adds
3x daily refreshes (open, midday, close)
Actionable trade ideas per section
"What it means for your trading"
Regime shift alerts intraday
Close-wrap end-of-day positioning
Full archive history access
Plans start at $63/mo (billed yearly) · Cancel anytime