Help us double down on what's working, instead of guessing. Takes 5 seconds, totally optional.
Market Overview
Data-driven market structure analysis powered by lab.flashalpha.com - volatility, dealer positioning, and regime assessment across the index complex, refreshed multiple times per trading day. Every number is pulled straight from our API endpoints by deterministic code.
FlashAlpha ResearchAI-assisted
Generated
Validated citations - no literal numbers from LLM
You're reading yesterday's market analysis
Basic unlocks today's post-open analysis (9:45 ET).
Growth unlocks all 3 daily refreshes (open, midday, close) plus actionable trade ideas and “What it means for your trading”.
Growth unlocks the full trading day: midday (12:30 ET) + close wrap (4:15 ET), actionable trade ideas per section, and “What it means for your trading” analysis.
Negative gamma across index complex with Steep Contango vol curve - dealers amplify moves into NVDA earnings.
SPY drifts under 767.77 into NVDA earnings while VIX at 15.84 rides Steep Contango - vol sellers still paid the carry but dealers are short gamma across the complex. The Put Wall at 760.00 is the line where flow flips from stabilizing to accelerant, and cross-asset tape stays Unknown despite geopolitical noise. Sizing stays Standard Size while VVIX at 88.52 keeps jump risk contained.
Dealer positioning levels
Symbol
Spot
Gamma flip
vs Flip
Call wall
Put wall
Max pain
Net GEX
Regime
SPY
763.69
767.77
-0.53%
770
760
754
-$7.43B
Short gamma
QQQ
706.54
711.43
-0.69%
730
700
700
-$2.19B
Short gamma
IWM
298.01
299.66
-0.55%
300
295
291
-$2.17B
Short gamma
VIX
15.84
16.16
-1.95%
20
15
20
-$13.82M
Short gamma
Spot below the gamma flip means dealers are short gamma and hedge with the move, which amplifies range. Above it they hedge against the move, which dampens it.
Volatility and risk premium
Symbol
ATM IV
HV 20d
VRP
25d skew
P/C OI
P/C volume
SPY
11.62
13.21
-1.59
1.52
3.05
-
QQQ
18.22
22.55
-4.33
2.92
1.22
-
IWM
15.14
15.75
-0.61
1.88
2.55
-
VIX
75.45
106.64
-31.19
-114.12
0.36
-
VRP is implied minus realised volatility. Positive means options are pricing more movement than has actually occurred, which favours sellers.
Volatility complex
Measure
Value
Change
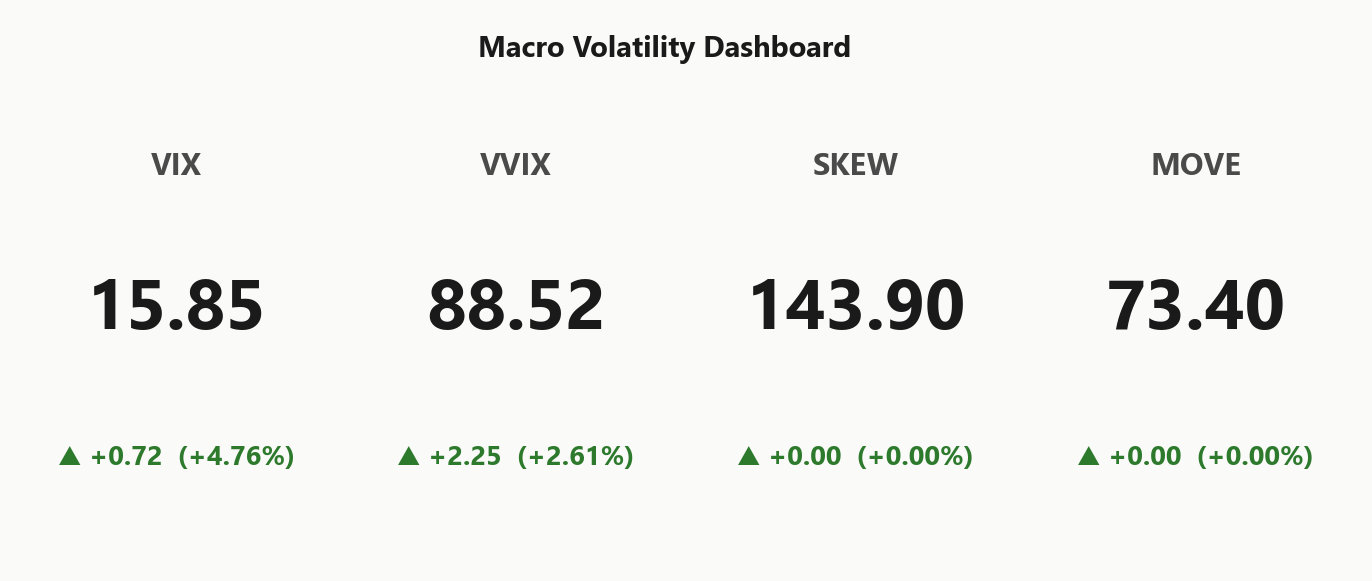
VIX
15.85
+4.76%
VVIX
88.52
+2.61%
SPX
7,652.86
-0.28%
SKEW index
143.90
0.00%
MOVE (bond vol)
73.40
0.00%
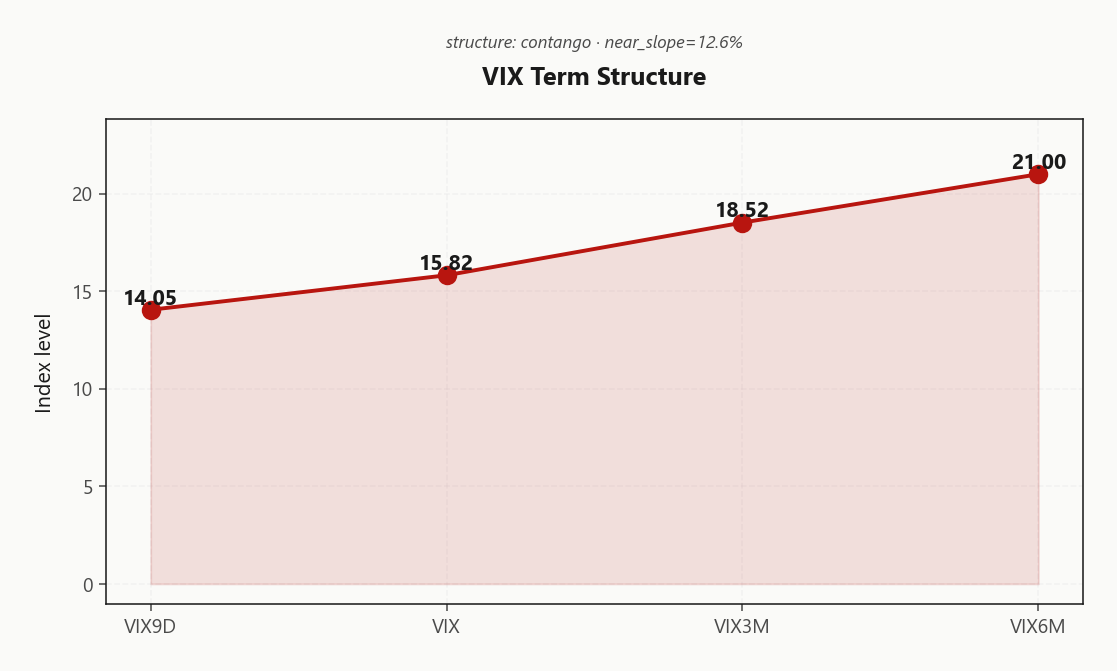
VIX term (9d/30d/3m/6m)
14.05 / 15.82 / 18.52 / 21.00
Steep contango
VVIX / VIX
5.58
Low
Regime
Elevated / Watchful
Regime Assessment
Regime reads Elevated / Watchful with VIX anchored at 15.85 - not the panic tape, not the sleepy one. The transition matrix argues this state is sticky: half-life of 15 sessions means the book you build today is the book you live with for multiple weeks, not a two-day tourist trade.
Panic-in-5 probability sits at 0.05 - contained, no fat left tail priced by the chain. Low-vol-in-10 at 0.45 is the more plausible drift, but plausible is not imminent. Base case between here and NVDA aftermath is chop inside the current envelope, with the amplifier zone below the flip live but not triggered.
Position for the sticky middle: size for the Elevated read, not for a regime change that the matrix says is unlikely inside a week. Reassess if VIX breaches back toward the low-regime band or if panic prob re-rates - both would invalidate the multi-week horizon this label implies.
What it means for your trading
Regime is Elevated / Watchful and sticky - half-life 15 sessions says plan multi-week, not multi-day, with panic prob 0.05 contained and drift-lower prob 0.45 the more likely off-ramp.
Trading readVIX up, VVIX up together, SKEW steady, MOVE sedate - this is equity-vol-only stress, not a cross-asset shock. Confirms the story is a known catalyst (NVDA + Iran headlines) rather than a systemic regime shift.VIX = equity vol. VVIX = vol of vol (is the fear gauge itself being stressed?). SKEW = cost of tail hedges vs ATM. MOVE = bond vol. Divergences between them (e.g. calm VIX but elevated VVIX) often precede regime shifts.
Forward Vol Geometry
The VIX complex prints clean Contango with near slope at 12.6%% - Steep contango - vol sellers favored. VIX9D at 14.05 sits under spot VIX at 15.82, which in turn sits under VIX3M at 18.52 and VIX6M at 21.00. The curve is doing what a vol-seller's curve is supposed to do - roll-down is paid, carry is live, and the term structure signals Steep Contango.
But read the front carefully. The kink from VIX9D up to spot VIX is event premium, not regime drift - NVDA earnings and Iran headlines layered into the very front tenor while the belly stayed anchored. The forward 30d→60d implied prints 19.7319385768, telling you the market prices only modest re-pricing on the other side of the event, not a step-change.
Trade the geometry: harvest premium in the 30-45 DTE bucket where the roll-down is cleanest and event premium has decayed out. Avoid the very front - you're renting event risk, not selling structural vol.
What it means for your trading
Curve is Steep Contango with the front kink flagging event premium, not regime shift - sell the belly at 30-45 DTE where carry is cleanest, skip the very front into NVDA.
Trading readContango slope is intact but the front-month kink from today's VIX pop is event premium, not regime change. Roll-down carry survives; sell the front, buy the belly if hedging NVDA risk in the term.Forward VIX curve: VIX9D (9-day), VIX (30-day), VIX3M, VIX6M. Upward slope (contango) = calm regime + vol sellers favored. Downward (backwardation) = stress, vol buyers favored. Slope matters more than level.
Realized Vol Structure
ATM implied is trading below trailing realized across the index complex - SPY ATM at 11.62% sits under HV20 of 13.21 and HV60 of 13.9. Options are cheap to what the tape has actually delivered, and VRP at -1.59% confirms sellers are no longer being paid the historical premium for warehousing the risk.
The IV-RV compression is wider in tech: QQQ VRP at -4.33% puts Nasdaq vol meaningfully under-priced to recent chop, while IWM at -0.61% sits closest to fair. Historically, negative VRP is a caution flag for naked short-premium - realized keeps eating the theta before it decays.
Playbook: lean into defined-risk - iron condors and put spreads over naked strangles - and avoid over-harvesting the front where the IV-RV gap punishes gamma-short exposure. If a catalyst spikes realized further, the negative-VRP setup turns naked short vol into a P&L trap.
What it means for your trading
Options are cheap to trailing realized across SPY, QQQ, and IWM with VRP negative on the complex - a warning to premium harvesters that the tape has been delivering more than the vol surface pays for. Prefer defined-risk structures and lighter sizing until IV re-couples with realized.
Skew Convexity
Downside is being paid up. SPY's quarter-delta put IV at 10.74% trades a full vol point rich to ATM at 9.66%, while the call wing at 9.22% sits under ATM - a textbook one-sided smile. Skew reads 1.52% with smile ratio 1.17%, firmly in put-heavy territory. Translation: hedgers are lifting protection, nobody is chasing upside convexity.
QQQ takes it further - skew at 2.92% prints materially steeper than SPY, the tech tail bid harder into the Put Wall pivot at 760 and Wednesday's NVDA print. VIX skew inverts the same story: call wing rich, tail hedgers active, no one selling the crash strike to finance anything.
Structure implication: put spreads over naked puts - you are the one buying the rich put wing, so finance it by selling the steeper downside strike rather than the flat call. On the upside, sell call verticals into the 770.00 wall where skew gives you nothing back. Naked short puts are the wrong side of this smile.
What it means for your trading
Skew geometry is emphatically one-sided - puts bid, calls flat, VIX calls rich - so any short-vol expression should be defined-risk and financed through the steep side, not the cheap side. Iron condor scored at 31 in the 30-45 DTE bucket remains the cleanest way to monetize the smile without wearing NVDA gap risk naked.
Vol-of-Vol Structure
VVIX at 88.52 against VIX at 15.85 puts the ratio at 5.58 - squarely in the Low vol-of-vol band. The market is not pricing a bimodal outcome into NVDA; there's no fat-tail premium being layered onto the VIX complex itself. That keeps sizing guidance at Standard Size - no need to cut clips defensively.
But don't read this as sleepy. VVIX ticked up 2.61% on the session alongside the VIX bid, which is the classic signature of orderly hedging demand ahead of a known catalyst - desks buying vol convexity, not panicking into it. Combined with the Steep Contango term structure and Elevated / Watchful regime, the read is: standard-size the Iron Condor, don't over-hedge the wings.
What it means for your trading
Vol-of-vol sits Low with ratio 5.58 - no jump premium priced, so run Standard Size into NVDA. VVIX's 2.61% tick confirms orderly hedging, not disorderly repricing.
Dispersion Spread
Index vol is on the floor while single-name tech is bid into the NVDA print - 11.62% SPY ATM sits at the low end of range against 18.22% in QQQ, and the tech-heavy tape is where the event premium is actually being paid. That gap is the dispersion trade: index correlation is soft, so an idiosyncratic NVDA miss won't propagate cleanly through SPY hedges.
Practically, index puts under-hedge single-name tail risk here. If NVDA gaps, the pain concentrates in the name and its immediate satellites before it bleeds into 706.54 and 763.69 - and by then dealers at -$160.98B vanna are already the accelerant, not the shock absorber. IWM ATM at 15.14% confirms the compression is broad, not SPY-specific.
Structure: buy single-name puts or put spreads on the tech leaders for the event, then rotate into index short-premium - condors between 760.00 and 770.00 in the 30-45 DTE bucket - to harvest the post-print vol crush once correlation normalizes.
What it means for your trading
Dispersion is wide with index IV compressed at 11.62% against a bid tech complex - hedge the NVDA event in single names, then sell index premium into the post-event decay.
Liquidity & Microstructure
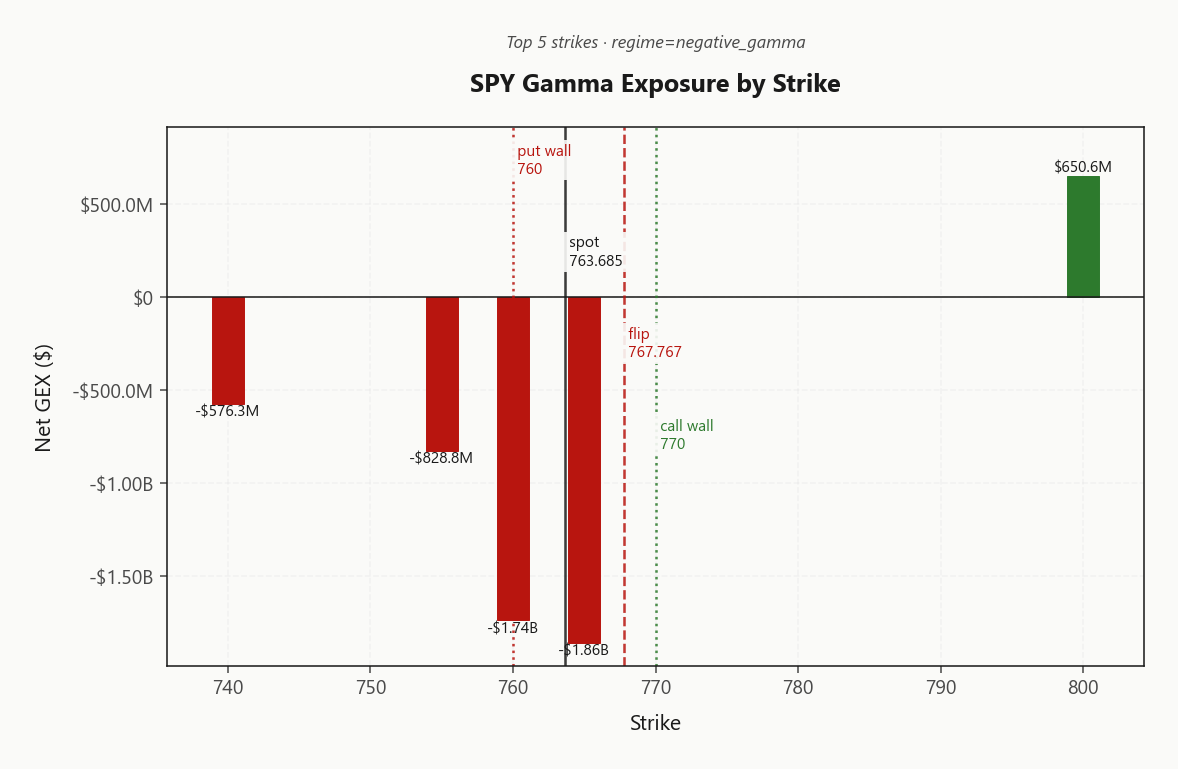
The strike map is unambiguous: SPY's dominant node sits at 765.00 carrying net GEX of -$1.86B - a put-heavy concentration parked directly beneath spot that defines the amplifier zone. The gamma flip at 767.77 hovers just above tape; a reclaim converts dealers from accelerants back into stabilizers and the character of every intraday impulse changes with it.
Between the walls, structure is clean: 760.00 is the downside cushion where dealer demand thickens, 770.00 is the upside magnet and fade line where supply reasserts. Breach the put wall and the OI stack below opens air - the Put Wall at 760 is the exact line where flow flips from stabilizing to accelerant, and spot sits -0.4825287913 away with a Neutral bias.
Ignore the headline OI print at 520 - that's a legacy LEAP anchor, not tape-relevant into NVDA. Trade the corridor, respect the flip.
What it means for your trading
The gamma flip at 767.77 is THE level: reclaim stabilizes the tape, loss of 760.00 unlocks the amplifier zone stacked at 765.00. Fade extremes into the walls, don't fight dealer flow between them.
Trading readDeep negative gamma stacked below spot at the put wall means dealers must sell into weakness and buy into strength - moves amplify below the flip and fade above the call wall. Trade the range between 760.00 and 770.00, don't fight the amplifier zone.Net dealer gamma exposure at each strike. Green bars = dealers long gamma (dampens moves toward the strike), red bars = short gamma (amplifies moves). Lines show spot, gamma flip (regime boundary), and the highest-gamma call/put strikes (walls).
Dealer Vanna & Charm
SPY net vanna sits at -$160.98B - a hostile profile where any vol pop forces dealer delta selling into weakness. That is the accelerant: an NVDA gap-down does not stop at the print, it compounds as vanna-driven supply layers on top of the negative-gamma amplifier already stacked below the flip.
Charm at -$269.2K adds a mild but persistent sell drift into the close - not a dominant force on its own, but directionally aligned with vanna and gamma. All three greeks point the same way, which is why the tape feels heavier than VIX alone suggests. The pivot is the Put Wall at 760, spot -0.4825287913 away with bias Neutral - the line where stabilizer flow flips to accelerant.
Worth flagging: QQQ vanna prints at $26.71B - a divergence from SPY's hostile read. Tech dealers less exposed to the vol-up-sell-delta trap heading into their own catalyst, which argues single-name NVDA hedges over QQQ index puts for the event.
What it means for your trading
Vanna hostile, charm mildly negative, pivot at the Put Wall760 - a VIX pop into NVDA compounds rather than stabilizes. QQQ vanna divergence at $26.71B favors single-name over index hedges for event risk.
Cross-Asset Confirmation
Cross-asset tape is telling a single story: this is an equity-vol event, not a systemic shock. MOVE sits at 73.40, sedate - rates desks are not pricing a regime shift, credit is not flinching, and the bond market refuses to validate the geopolitical headline reel around Iran and Canadian tariffs. When equity vol lifts without MOVE lifting alongside, the read is concentrated catalyst risk, not contagion.
Sentiment confirms the same. Fear & Greed prints 55 at Greed - no capitulation, no washout, no contrarian bounce trigger. The index complex is uniformly aligned: QQQ at 706.54 and IWM at 298.01 both sit in negative gamma alongside SPY, tone reading Unknown with regime divergence flat at Aligned. No cross-asset hiding place, but no compounding stress either.
Trade the tape as mean-revertible - headline vol without rates panic. Fade extremes, respect the walls, avoid confusing a concentrated tech-event bid for a broader risk-off unwind.
What it means for your trading
MOVE at 73.40 and F&G still Greed confirm this is a contained equity-vol event, not a credit or rates shock - treat weakness as mean-revertible into the walls rather than the start of compounding stress.
Scenario EV
The scoring model lands on Iron Condor at 31, decisively ahead of put spreads at 16. With VRP at -1.59% flagging options cheap to realized, the edge is defined-risk premium harvest rather than naked short vol - you get paid for the range without owning the tail that negative VRP warns about.
Sweet-spot tenor is 30-45 DTE, cleanly past the NVDA print and into the belly where the Steep Contango roll-down is uncontaminated by event premium. Wing placement writes itself: put wing anchored near 760.00, call wing pinned at 770.00 - the same rails dealer positioning will defend so long as spot respects the flip at 767.77.
Sizing stays Standard Size per the Low VVIX regime at 88.52. In a Elevated / Watchful tape with half-life 15 sessions, this is a multi-week trade - trim if spot loses the put wall on NVDA reaction, respect the pivot at 760.
What it means for your trading
Iron condor scores 31 versus put spreads at 16 - defined-risk wings between 760.00 and 770.00 in the 30-45 bucket, sized Standard Size. Negative VRP argues against naked short vol; the condor captures range without owning the fat tail.
Actionable Summary
Bottom line: deploy Iron Condor structures between the walls in the 30-45 DTE bucket, wings pinned at 760.00 and 770.00. The pivot at 760 is the line - spot sits Neutral and a loss of the put wall on the NVDA reaction accelerates given negative gamma below the flip at 767.77.
Do: fade extremes into the walls, size defined-risk against the Elevated / Watchful regime, and trim aggressively if 760.00 breaks - dealer vanna at -$160.98B compounds a vol-up move. Avoid: naked short strangles with VRP at -1.59%, and chasing upside above the 770.00 dealer sell wall. Watch: a reclaim of 767.77 flips tape character from amplifier to stabilizer - that is the trigger to rotate from condors to directional call spreads.
What it means for your trading
Trade the 760.00/770.00 channel with defined-risk condors in the 30-45 window; the flip at 767.77 is the regime switch that changes everything.
NVDA earnings preview matters because a single-name print will dictate tech vol, index vanna, and probably the week's tape - every desk is already pre-positioned.
US threats on countries trading with Iran keep geopolitical premium in oil and defensive names without triggering a rates panic - headline vol without regime shift.
CNBC downgrading two AI names before NVDA suggests sell-side is de-risking narrative exposure, which pressures the mega-cap tech complex feeding index gamma.
US eyeing 7.5% China overcapacity tariffs before Xi-Trump talks re-injects trade-war tail risk into cyclicals and semis exactly when semis are already on watch.
German minister blaming bond-yield surge on 'Trump's war' underscores that fixed-income repricing is now a political-narrative risk, not just a macro one - MOVE bears watching.
Trump escalating Canada auto tariffs to 50% is a January-2027-dated risk but pre-prices industrials and autos immediately - supply-chain vol repricing already underway.
Cramer's pre-NVDA watchlist matters as a retail-flow proxy; overlaps between his AI names and heavy OI concentration flag where retail hedging kicks in first.
Frequently Asked Questions
What is the current market volatility regime?
VIX is trading at 15.84 with a Contango term structure. The Fear & Greed index reads Greed, and cross-asset volatility is Aligned across SPY, QQQ, and IWM.
SPY's gamma flip is at 767.77 against a spot of 763.69. Above flip, dealer hedging is suppressive; below it, hedging amplifies moves.
Is implied volatility rich or cheap versus realized?
SPY's at-the-money implied vol is 11.62% with a volatility risk premium of -1.59%. Negative VRP means options are cheap relative to recent realized moves; positive VRP means insurance is expensive.
What does the VIX term structure say today?
The VIX curve is in Contango with VIX at 15.85. Contango signals benign forward expectations; backwardation signals near-term stress.
You're reading yesterday's market overview. Upgrade to Basic and get today's post-open analysis - the same data institutional desks use to set positioning each morning.
Unlock the full trading day
You see the market-open report. Growth gives you all 3 daily refreshes - midday regime shifts, close-wrap positioning, plus actionable trade ideas and "What it means for your trading" analysis.
What Basic includes
Today's market-open analysis
SPY, QQQ, IWM, VIX gamma regime
Key levels - flip, walls, max pain
VIX term structure + VRP analysis
Charts with trading reads
Full API access to lab.flashalpha.com
What Growth adds
3x daily refreshes (open, midday, close)
Actionable trade ideas per section
"What it means for your trading"
Regime shift alerts intraday
Close-wrap end-of-day positioning
Full archive history access
Plans start at $63/mo (billed yearly) · Cancel anytime